Ongoing Survival Analysis
Adult White-Tailed Deer Survival
Introduction and Methods
White-tailed deer survival from the WIDNR southwestern deer study during the first two years, from 2017-2018, suggests that mortality of chronic wasting disease (CWD) infected deer is lower than uninfected deer. These results are based on analyses of data from captured and collared adult individuals during the winters of 2017 and 2018. It is still early in south-central Wisconsin study, so we suggest caution with interpretation of all results based on these 2 years. Three additional years of survival data are being collected.
Survival was obtained with a conditional continuous time to event model (Kalbfleisch, 2002). The basic formulation of the likelihood can be found in Walsh et al. (2017) and accommodates staggered entry, left truncation and interval-censored data. Adult survival was modeled on a weekly time scale, because it was sufficiently fine-scale given the life history and high annual survival rates of white-tailed deer in the Midwest. Individuals surviving to the end of the study period were right censored at 104 weeks. Capture-induced mortalities were also right censored. A piece-wise constant hazard model was used to approximate the unit cumulative hazard model. Multiple models were fit using Bayesian methods and implemented in nimble (NIMBLE Development Team, 2019), with standard diagnostics indicating no lack of fit. The first model included a constant indicator for CWD status (positive or negative at capture or after mortality when available) in the log hazard function, and a second model included covariates for both disease status and sex of the collared individuals.
One of the assumptions of our models is that true CWD status does not change over time. However, we acknowledge this assumption does not hold in practice, because individuals may become infected after collars are deployed. The current formulation does not incorporate the disease process model as a time-varying covariate. However, going forward, we plan to incorporate the state transition from susceptible to infectious/infected using a force of infection transmission model.
For the present work, we model CWD status using a zero-inflated Bernoulli distribution, similar to the model we used in 2017. The zero-inflated disease status model accounts for the live RAMALT test characteristics (Thomsen et al., 2012). In de-populated captive cervid farms in Canada and the US, Thomsen et al. (2012) calculated a pooled sensitivity of the RAMALT test of 68% with 95% credible limits of 49 and 82. We incorporated this test sensitivity for the individuals who tested negative for CWD at capture using a zero-inflated Bernoulli model. Thus, observed CWD status at capture is modeled with a Bernoulli distribution that depends on the true disease status at capture and the probability of detecting the disease given that it is actually present, also known as the test sensitivity (p). The true disease state (z) was also modeled with a Bernoulli distribution depending on the prevalence (ψ) of the disease.
zj ∼ Bernoulli (ψ),
p ∼ beta(92.5, 44.5),
ψ ∼ uniform(0,1),
for j in 1,…,J records. A flat uniform (0,1) prior distribution was specified for prevalence (ψ). The parameters in the informed prior beta distribution of sensitivity (p) were moment matched (Hobbs & Hooten, 2015) from the pooled estimate of sensitivity from Thomsen et al. (2012). Flat normal prior distributions were used for all coefficients in the hazard rate model. A truncated normal prior was used for the intercept (β0’), along with an additional mixing parameter (α) to help with convergence, such that
α ∼ uniform (−1, 1),
β0 = β0’ × α.
The lower (2.5%) and upper (97.5%) quantiles of the complementary-log-log transformation of the prior distribution for β0 in probability space was 0 to .99, providing a prior distribution across the full range of probability values despite the truncated prior and mixing parameter. In the previous analysis, we used a constant hazard with additive effects of CWD status, sex, and hunter harvest on mortality. We improved upon the constant formulation with a regularized model. We used an intrinsic conditional auto-regressive (ICAR) prior model in the log hazard to account for dependence in the log hazard over time. The ICAR prior for the weekly time effect was
for k = 1,…,104 weeks, where ![]() , and was parameterized in terms of precision (τ). We used additive terms for CWD status and sex that allowed for different curves for mortality for these groups. We used two versions of the model, one version only included CWD status, and the other included both CWD status and sex. The linear model for the log hazard of the model with CWD status only was given by
, and was parameterized in terms of precision (τ). We used additive terms for CWD status and sex that allowed for different curves for mortality for these groups. We used two versions of the model, one version only included CWD status, and the other included both CWD status and sex. The linear model for the log hazard of the model with CWD status only was given by
![]()
for the jth individual during the kth week of the study. Similarly, the linear model for the log
hazard including both CWD status and sex was
![]()
with the same parameterization of δk .
Results: CWD Only Model
Hazard Model Results
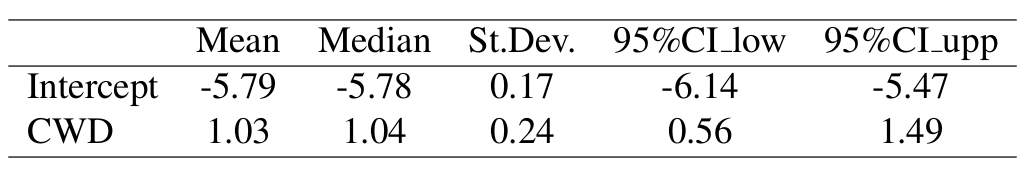
Posterior distributions of the coefficients in the hazard rate models were obtained. The credible bounds for the coefficient for the estimated true CWD status were positive, suggesting that CWD increases mortality rates.

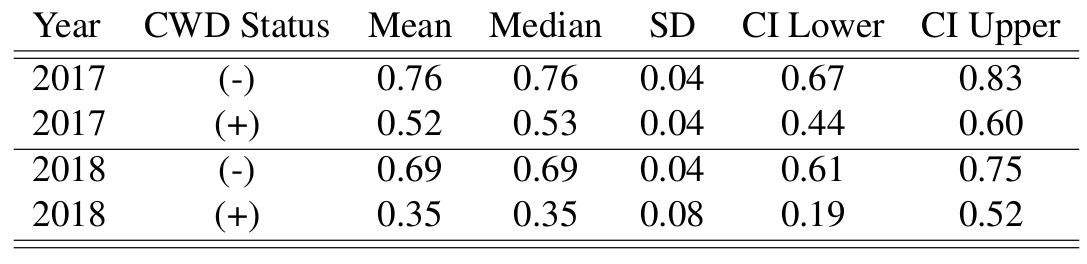
Annual Survival Probabilities
The model was fit from the beginning of the study through the end of the second year of data available. Annual survival for the second year was obtained by conditioning on the probability of surviving the first year of the study.
CWD Prevalence
An artifact of the model specification accounting for chronic wasting disease status, is that we can obtain an estimate of prevalence of CWD, assuming that disease status does not change after capture and collaring of individuals. The posterior distribution of prevalence is higher than the first year analysis, and is more closely aligned with CWD prevalence estimates previously obtained from this region. This prevalence estimate also assumes constant exposure across space and time, which does not accurately reflect heterogeneities of infection patterns. This was included to show prevalence of the collared individuals only, and should be interpreted in this limited domain.

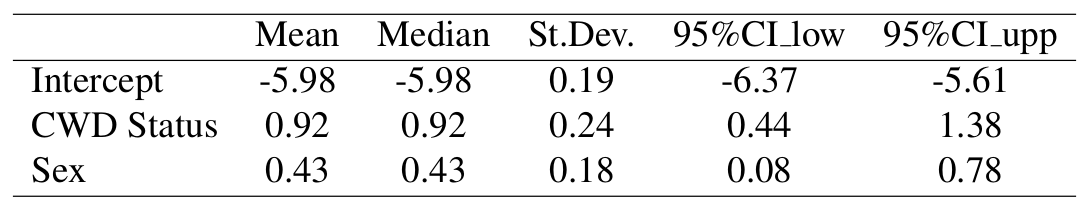
Results: CWD Status & Sex Model
Hazard Model Results
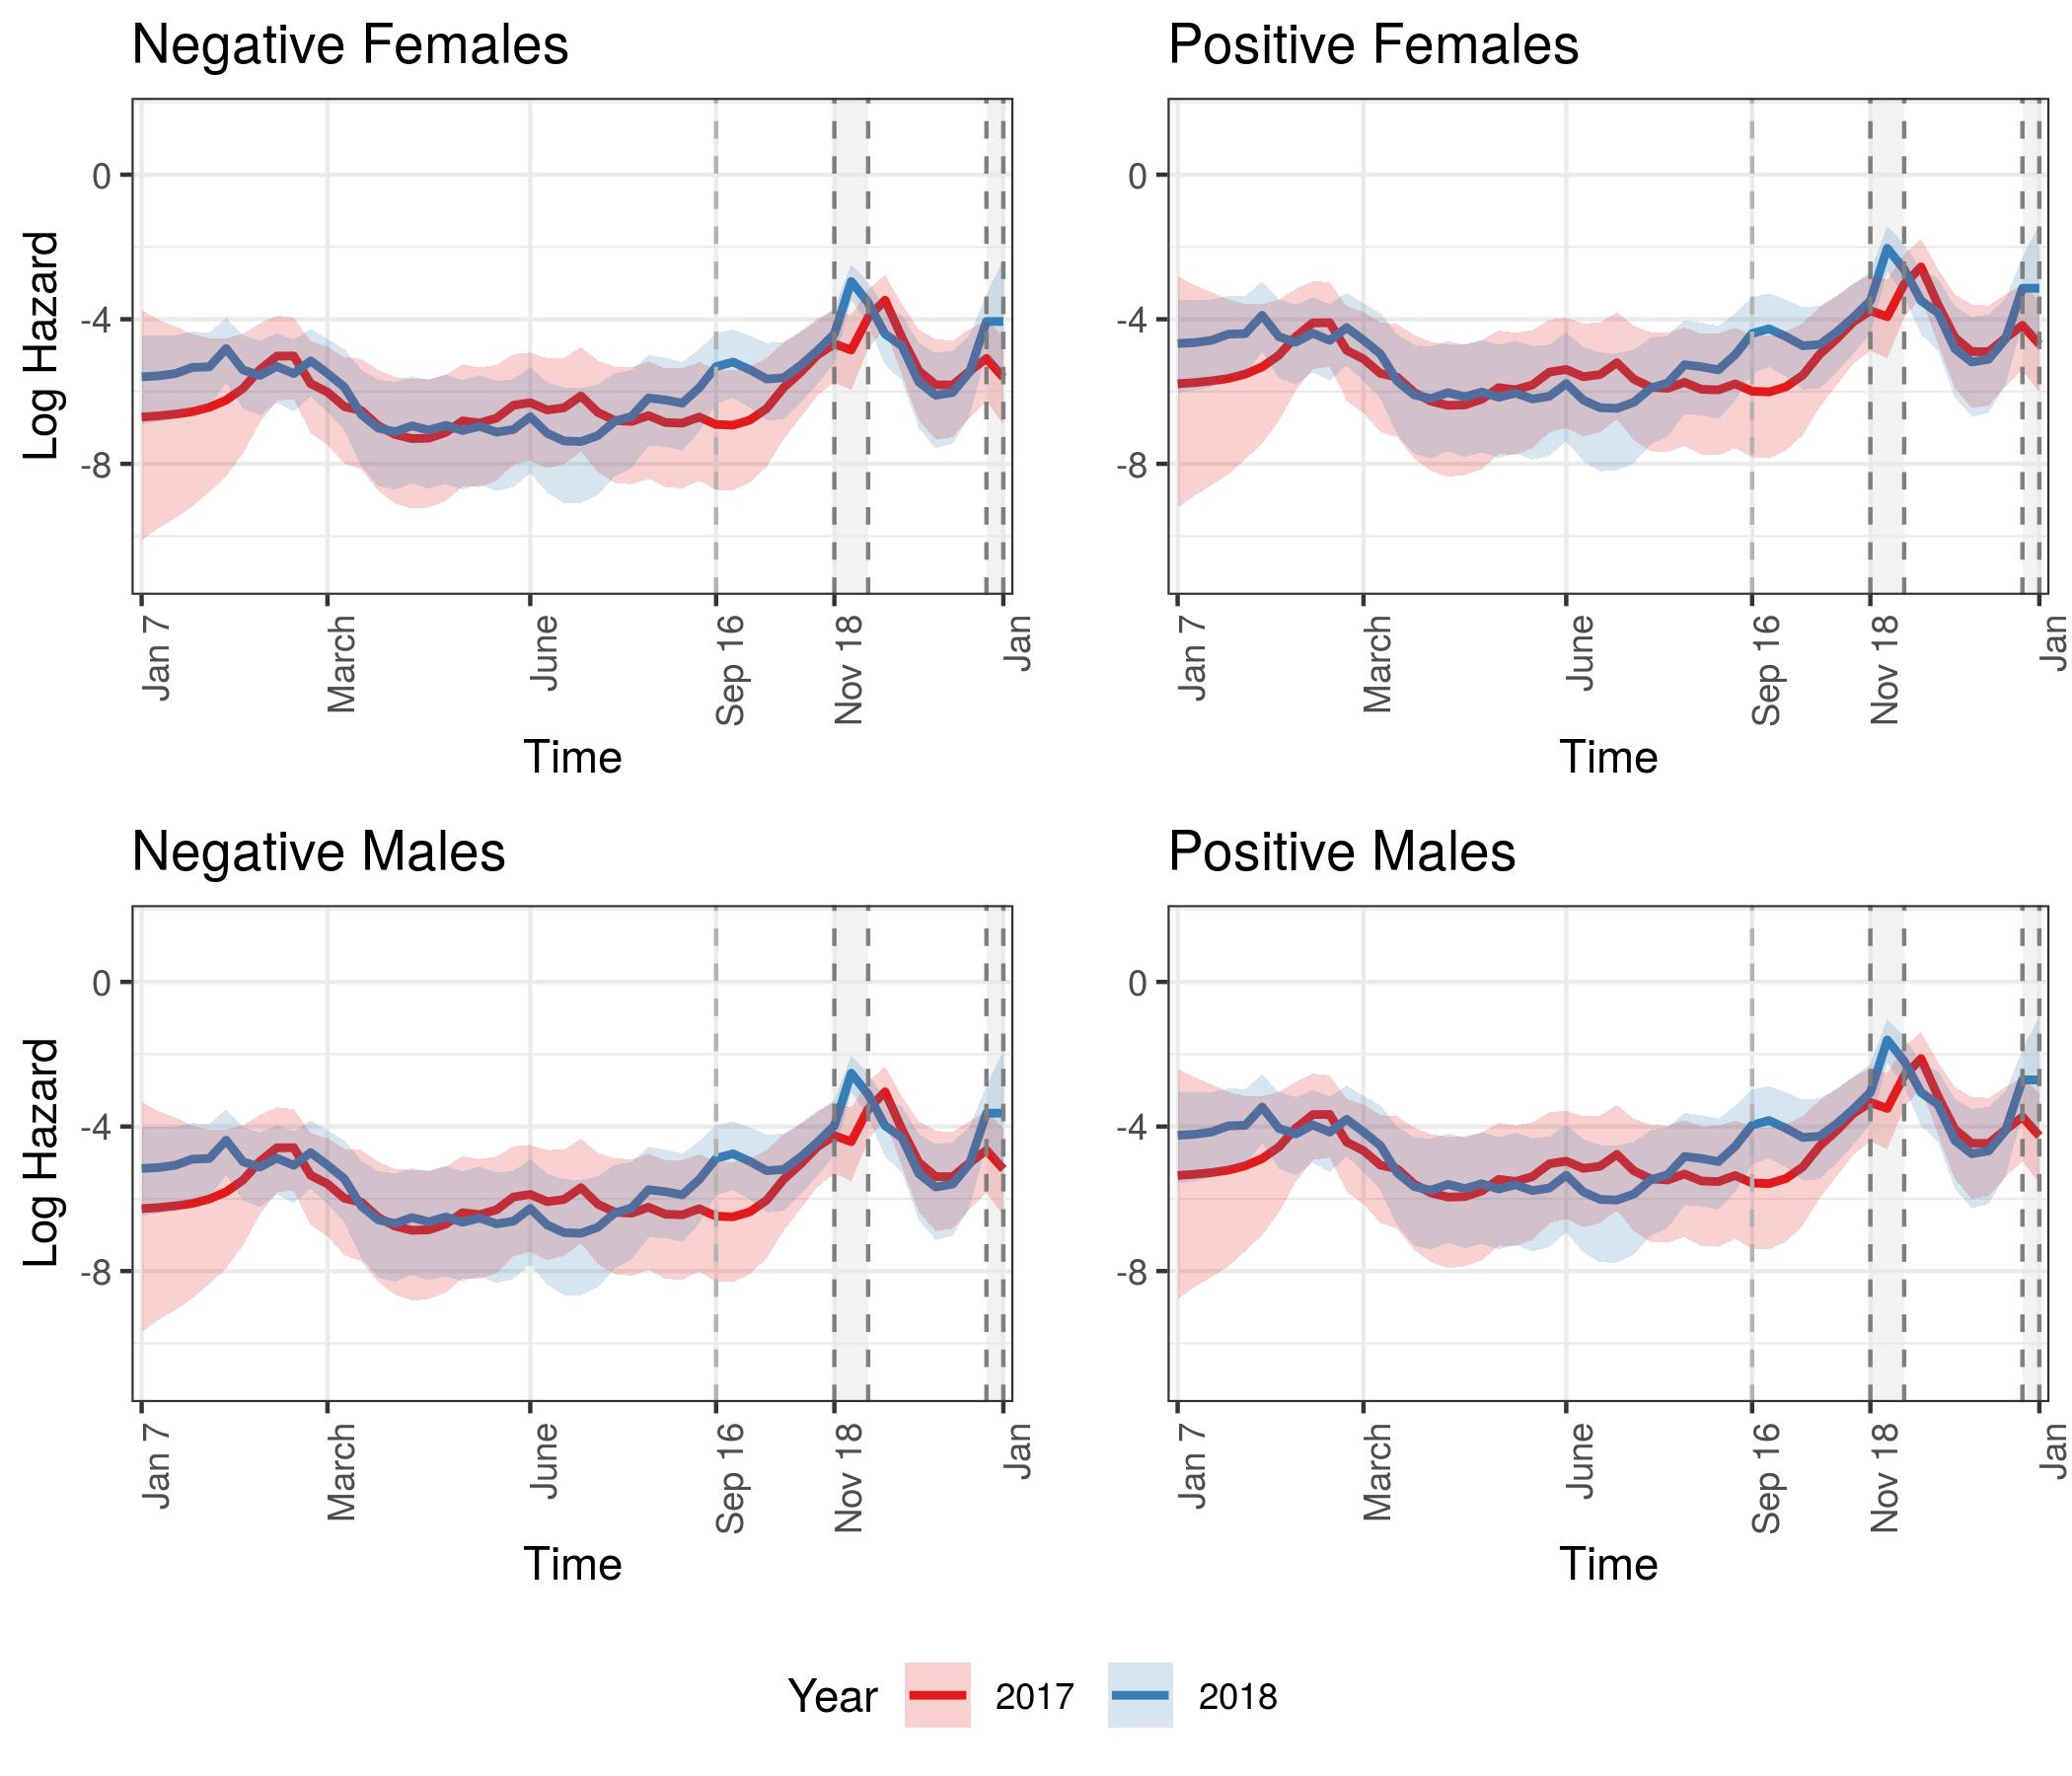
We have begun to see differences in mortality between the sexes given CWD status, with an additional year of data collection. Credible bounds were wide and overlapping, although unlike in the first year’s analysis, differences between the sexes are emerging. Summary statistics of the posterior distributions of the coefficients in this model were obtained for fixed effects given CWD status and sex. We used the same zero-inflated Bernoulli model to obtain CWD status to be used as a covariate in the log hazard model, as we did in the CWD only model above. The only difference between this model and the previous model is that we included the additive effect of sex, with the indicator variable for sex being 1 if the individual was a male and 0 if female.
Annual Survival Probabilities
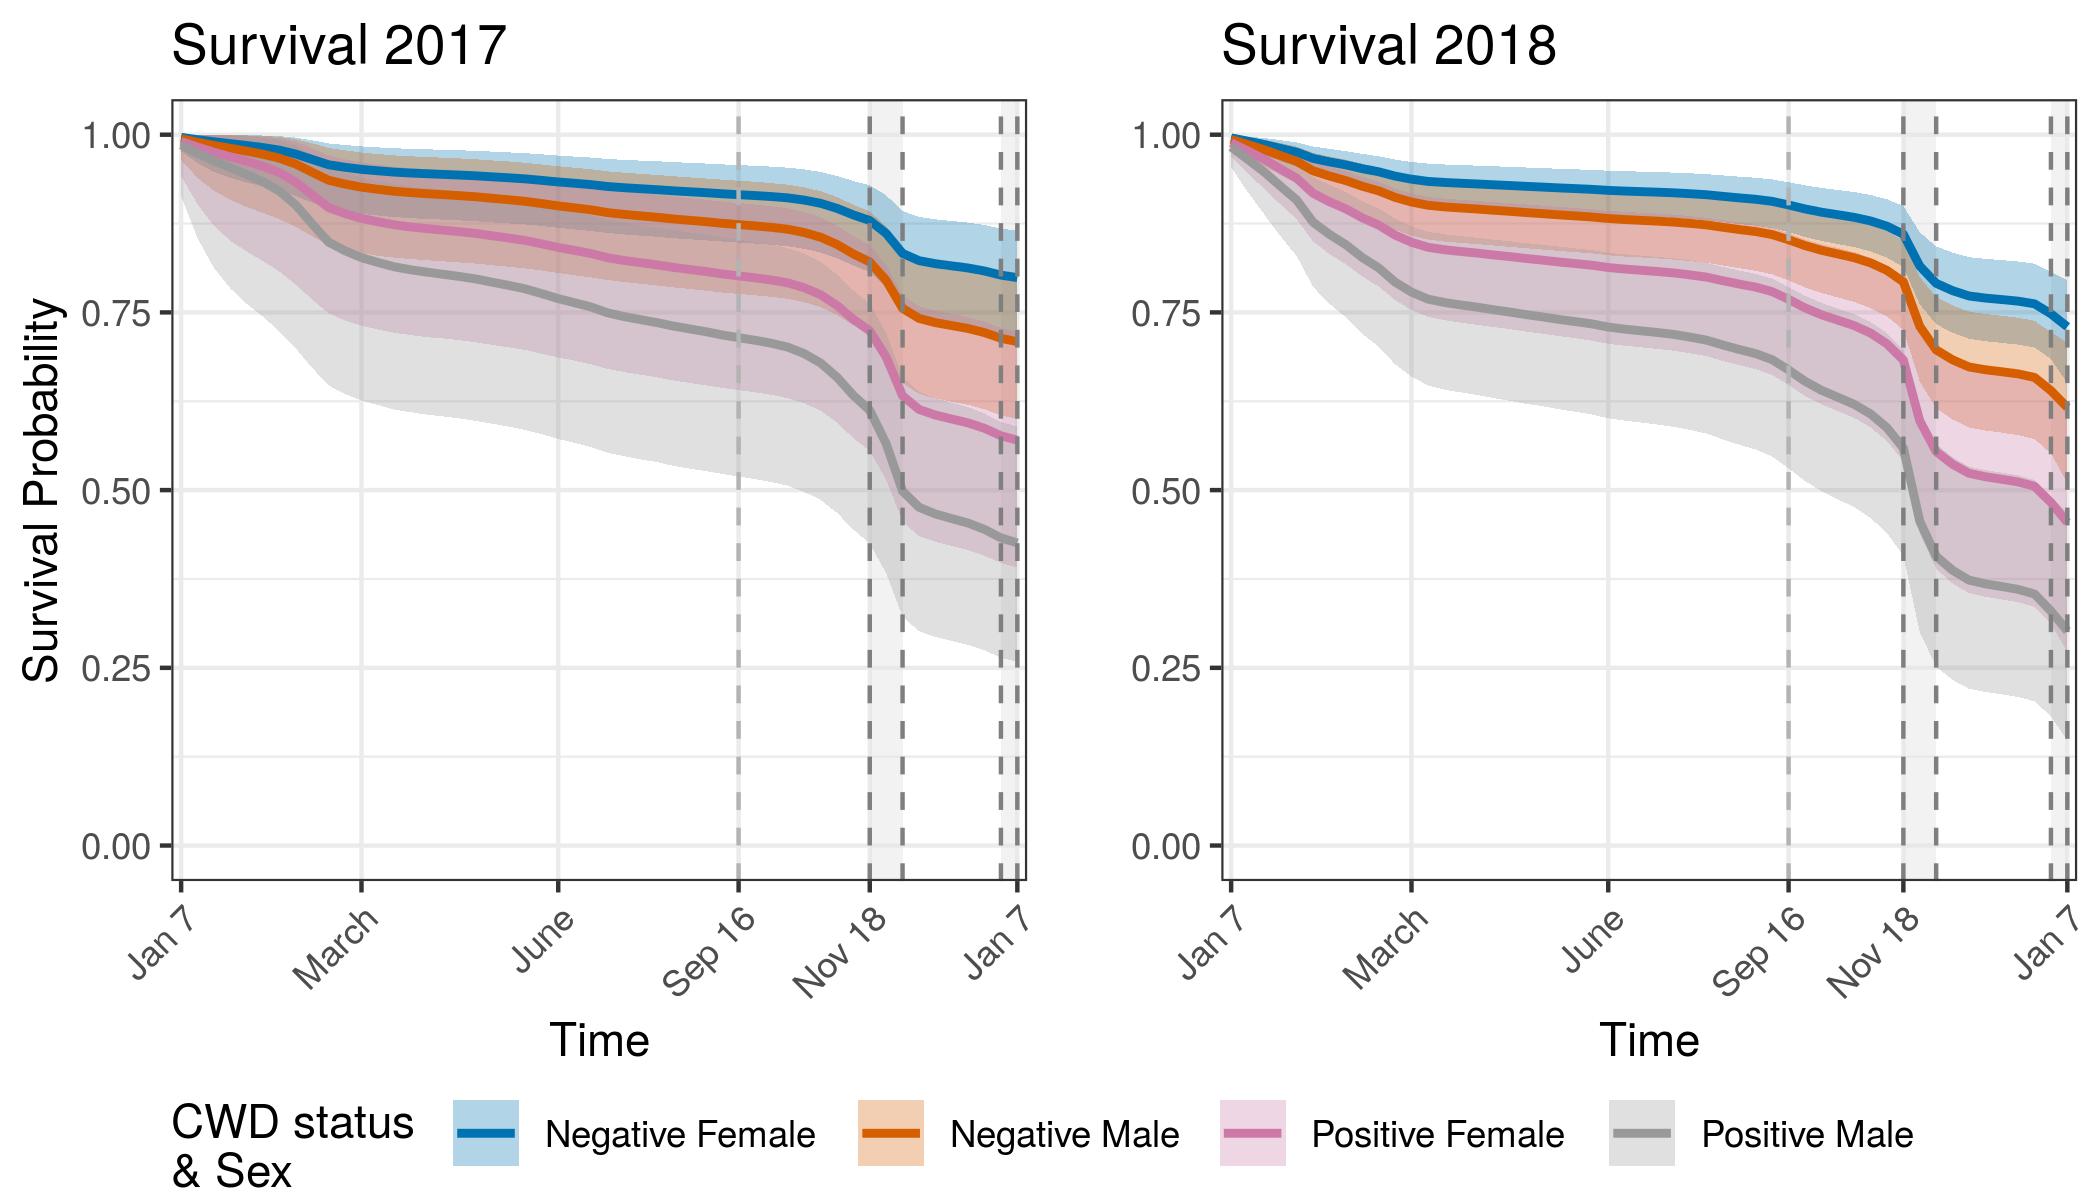
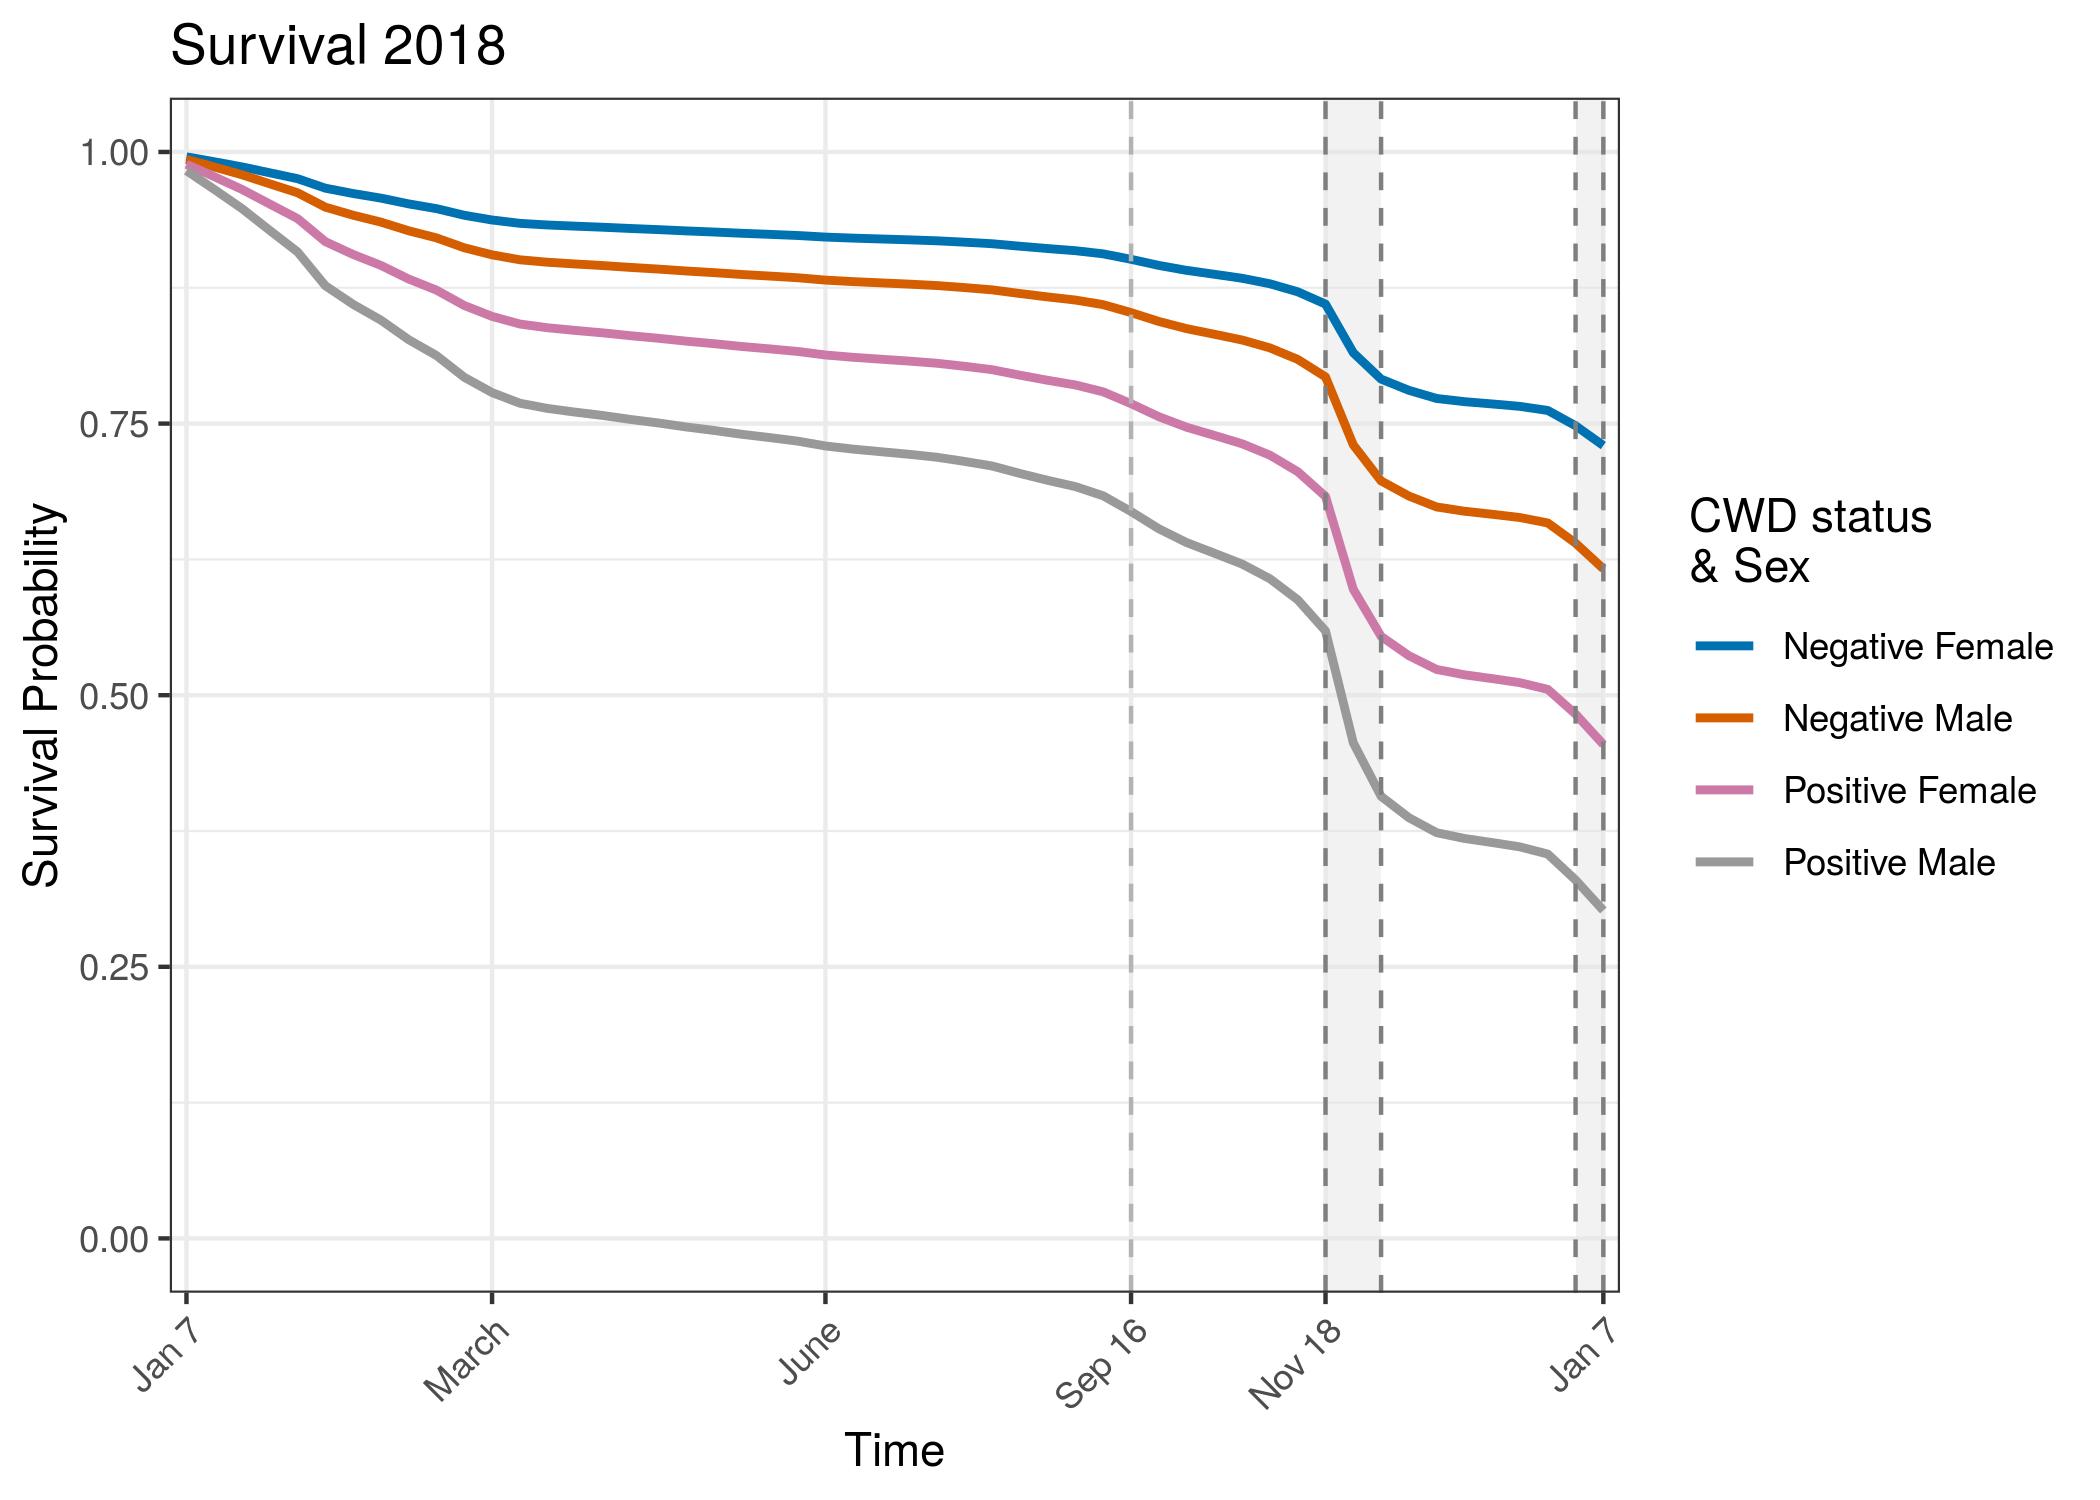
Conclusion
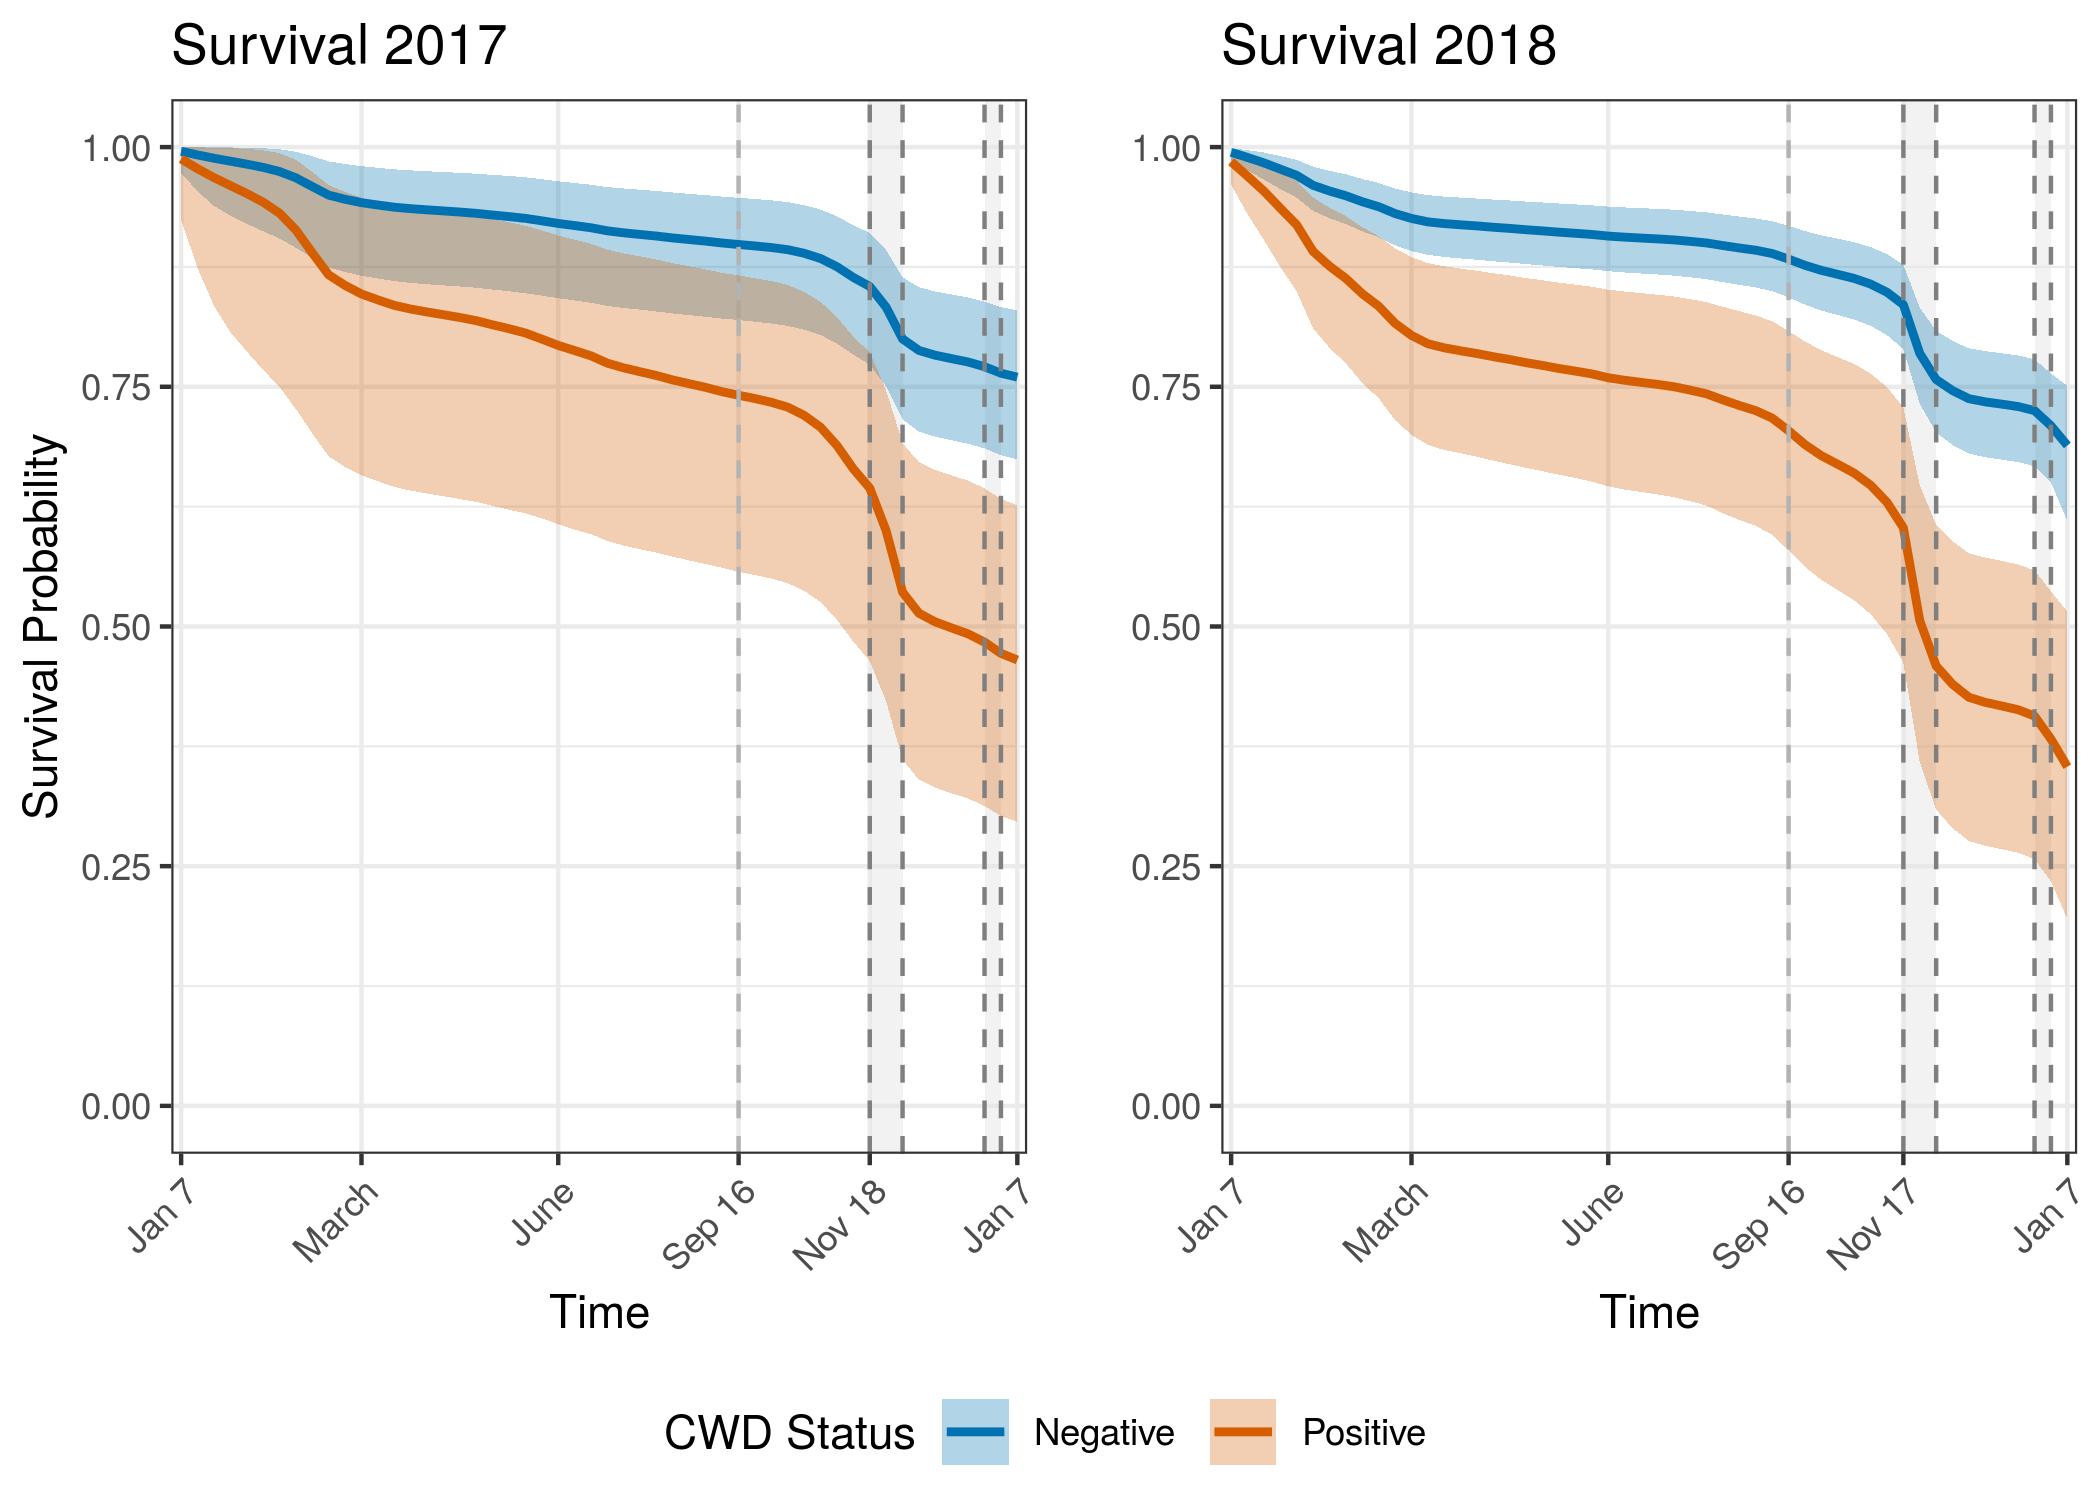
There is a striking and consistent trend showing lower survival for CWD infected individuals even if the proximate cause of death was not CWD. The survival curves show an increase in precision with the second year of data. The credible interval bounds are barely overlapping in 2018, between CWD infected individuals and uninfected individuals. Survival for both groups was lower in 2018 than in 2017. This may be an artifact of sampling. Because 2018 includes individuals from 2017 that have aged 1 year, potentially the overall sample of individuals is older than the population. This why in future models we will attempt to include an age-specific component of survival. There could also be differences in mortality from 2017 to 2018 that these curves are showing. Weather patterns have been different between these two years, especially during the hunter harvest seasons. Research is ongoing to expand the adult survival models to also include age effects in the regularized hazard model. We will also incorporate the force of infection model to include disease state transition over time.
Literature Cited
Hobbs, N.T. & Hooten, M.B. (2015) Bayesian Models: A Statistical Primer for Ecologists. Princeton University Press, Princeton, New Jersey, USA.
Kalbfleisch, J.D. (2002) The Statistical Analysis of Failure Time Data. J. Wiley, Hoboken, N.J., 2nd ed.
NIMBLE Development Team (2019) NIMBLE: MCMC, Particle Filtering, and Programmable Hierarchical Modeling.
Thomsen, B.V., Schneider, D.A., O’Rourke, K.I., Gidlewski, T., McLane, J., Allen, R.W., McIsaac, A.A., Mitchell, G.B., Keane, D.P., Spraker, T.R. & Balachandran, A. (2012) Diagnostic accuracy of rectal mucosa biopsy testing for chronic wasting disease within white-tailed deer (Odocoileus virginianus) herds in North America: Effects of age, sex, polymorphism at PRNP codon 96, and disease progression. Journal of Veterinary Diagnostic Investigation 24, 878–887.
Walsh, D.P., Norton, A.S., Storm, D.J., Van Deelen, T.R. & Heisey, D.M. (2017) Using expert knowledge to incorporate uncertainty in cause-of-death assignments for modeling of cause-specific mortality. Ecology and Evolution 8, 509–520.